You’ve done a considerable amount of user research. You’ve gathered a ton of user insights and now you have to somehow make sense of it all. Where do you start!? It can be a daunting task. Synthesising and making sense of your user research insights and connecting the common threads between them can seem overwhelming, however, mark our words, you NEED to synthesise the learnings.
Ineffective user research synthesis risks wasting the time, money and resources that have been spent on user research. You also run the risk of making decisions that don’t properly consider your customers’ needs and wants.
Thankfully, there are systematic and structured ways of synthesising your user research insights. This article will outline an approach to effectively make sense of user research insights.
Why Synthesise User Research?
Synthesising user research is a critical part of the user research process. If you don’t do it, all you’ll end up with from user research is a lot of fragmented, disorganised insights. You won’t be able to ‘zoom out’ and discover any themes or patterns that will likely emerge from your user research… and you won’t get anywhere near the level of insights you otherwise would into what your customers’ needs, wants and pain points are – insights which your organisation can then use to help make more user-centric decisions.
User research synthesis:
- Helps you identify patterns and themes that likely exist throughout your user research insights gleaned from various sources.
- Ensures that you don’t waste the time, money and resources that have been spent on user research.
- Minimises the risk of making decisions that don’t properly consider your customers’ needs and wants.
- Helps you discover more about your customers.
- Helps you discover and prioritise the important user problems and needs.
- Helps you create and/or validate design artefacts such as user personas, customer value proposition maps and empathy maps.
- Serves as a tool to communicate user research findings with your team and stakeholders.
How to Do It?
There are potentially a lot of sources of user research insights – including but by no means limited to – customer interviews, usage data, surveys, observation & contextual enquiry, card sorting, and diary studies. These sources of insights can generate a lot of information to make sense of.
So, how do you make sense of the insights from potentially many sources and how do you discover the patterns and themes that tie various insights together? And, more importantly, how do you make these learnings available to the wider organisation?
Essentially, the synthesis process involves 4 high-level steps:
1. Extract learnings – you will need to extract useful insights about your customer’s preferences and ways of thinking, from the raw information that you gather from your user research activities.
2. Organise & group – this step is about making sense of and categorising the “mess” of data produced from your user research activities, into a format that can be referred to by anyone throughout the organisation.
3. Generate insight statements – this step is about creating short statements that summarise key insights from your research.
4. Generate “how might we” statements – this step is about creating short statements that reframe our insights into opportunity areas to innovate on problems found during user research.
Here is the process in more detail:
Step 1 – Extract Learnings
The learnings that you get from qualitative or quantitative data are what have an impact on a product and an organisation. Not the raw data itself.
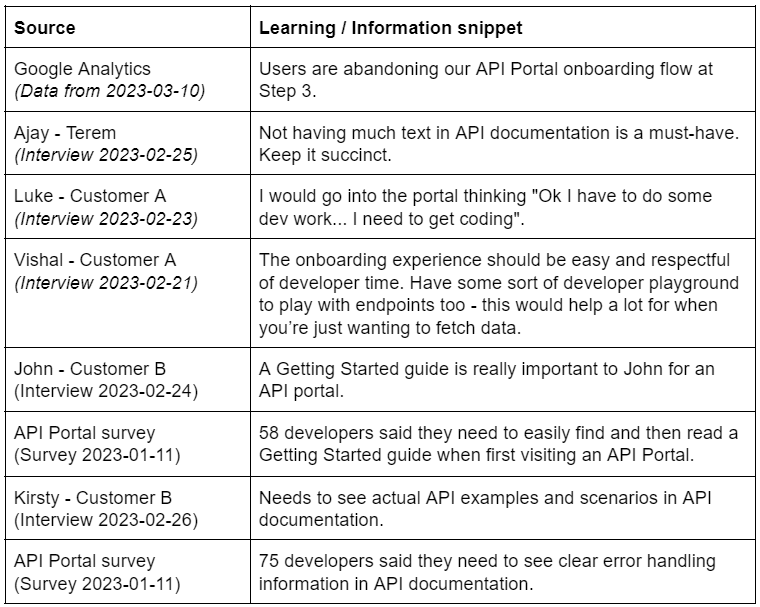
This step of the process involves going through your various sources of user research data and extracting “snippets” of useful information from that data. These snippets of information are just little bits of useful learnings from your user research.
It is often useful to paraphrase (if they are complex or hard to understand) these to keep them clear, succinct and easy to read. For reference purposes, make sure to capture the source of the information, as well as the date the information was created.
Note that these information snippets can come from any source of data – qualitative (e.g. interviews, surveys) or quantitative (e.g. usage data from Google Analytics).
An example of capturing user research learnings as “information snippets” is as follows:
Step 2 – Organise and Group
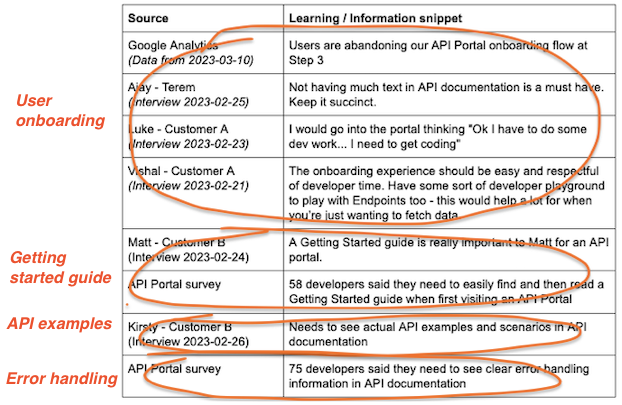
This step of the process involves conceptually grouping the information snippets; commonalities and similar themes will exist amongst all the learnings/snippets of information that you capture from your user research. Especially if you have captured larger volumes of learnings.
Make sure to look for these similar themes and commonalities.
Here is an example of this concept:
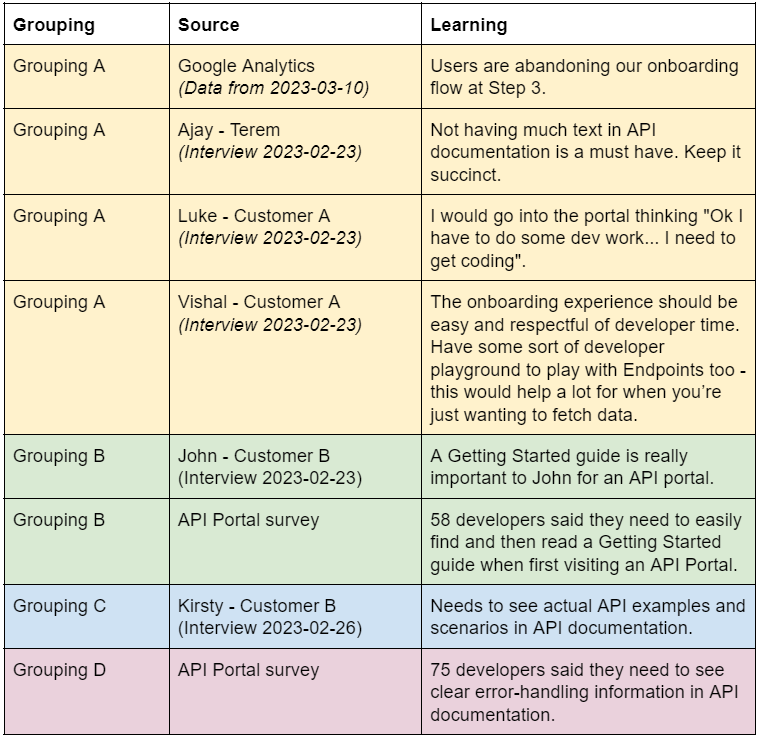
Once you have identified the various conceptual groupings that exist within the snippets of information, you can create group labels for each group:
Step 3 – Generate Insight Statements
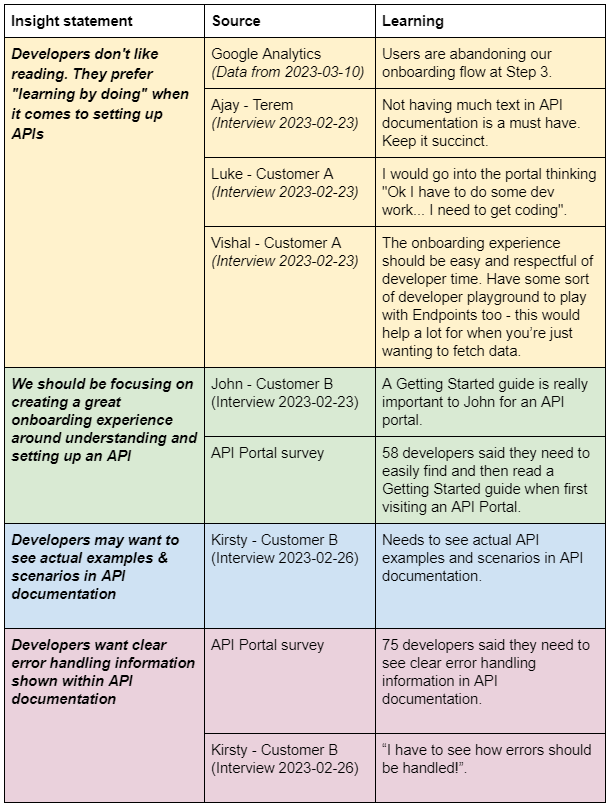
After everything has been organised and grouped, you can then generate insight statements for each grouping of information snippets. These will replace each group label.
Insight statements are short, succinct statements that summarise a key insight from your analysis of a particular piece of data or grouped-together data (via affinity mapping) from user research.
Here is an example outlining how this can be done (see the first column in the table, “Insight Statement”):
Once you have come up with a list of statements in this way, if there are common themes between insight statements, then you then group these insights statements into overarching themes, as follows:
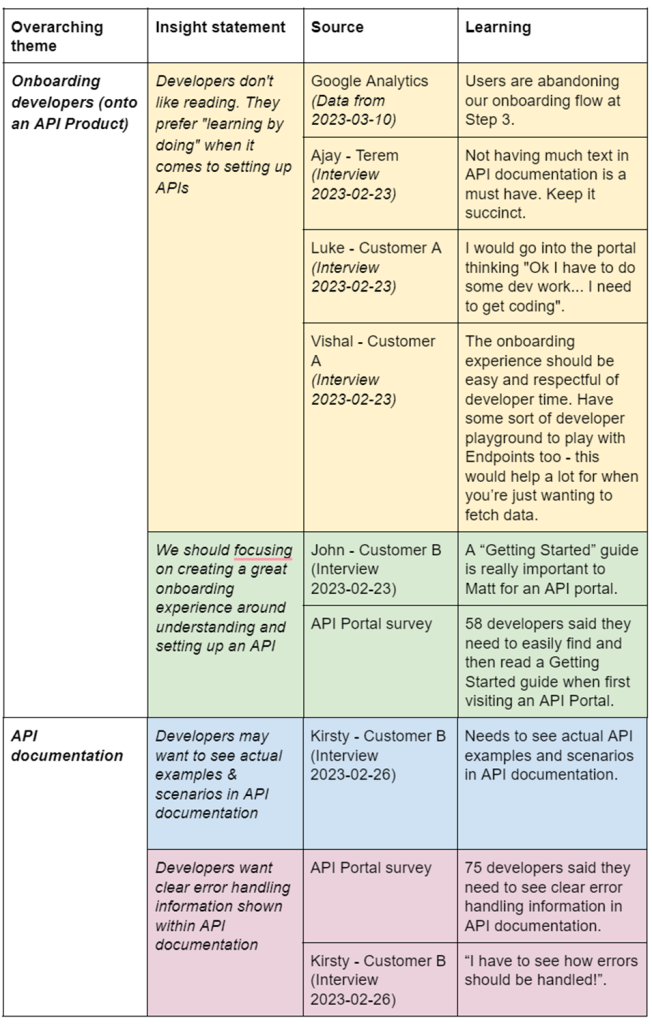
You can also then group the overarching themes together into categories, if you have multiple overarching themes that have conceptual groupings between them.
From here on out, it is a process of doing this for ALL your information snippets.
Note that you can also do all of this in spreadsheet, an example of which is provided below:
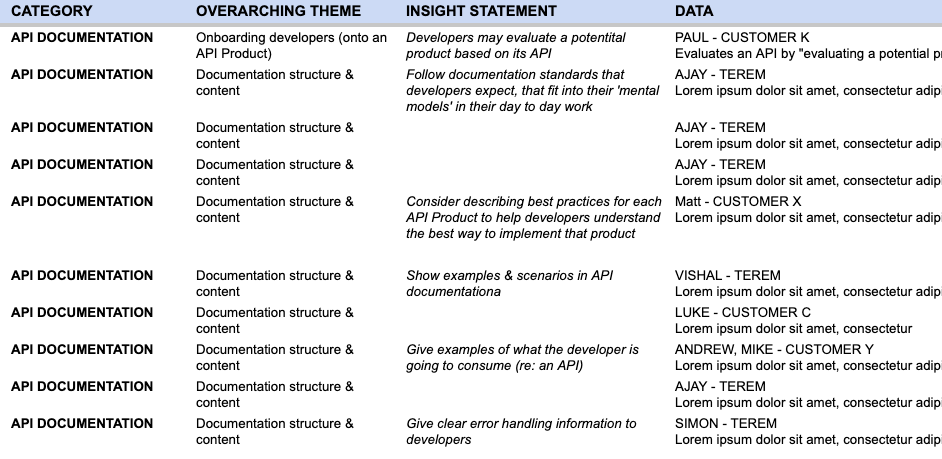
The advantage of doing it in a spreadsheet is that you can easily filter insights and the data supporting them, by category, subcategory, grouping and insight. A spreadsheet can also support the storage of a huge amount of insights.
On the other hand, you can also synthesise user research in a digital whiteboard tool like Miro (https://miro.com/). The advantage of doing it in a visual board like Miro is that you can see the hierarchy more visually and zoom in and out of it easily. However, it isn’t possible to easily filter data in a visual board, unlike with spreadsheets.
The following examples show how you can go about synthesising user research in a visual tool like Miro:
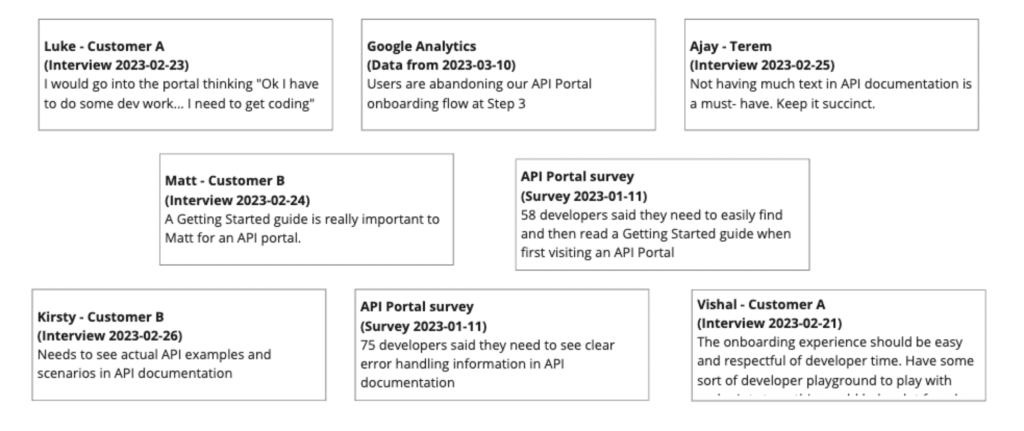
1. Capture raw learnings as “information snippets”:
2. Group information snippets together into conceptually related groupings:
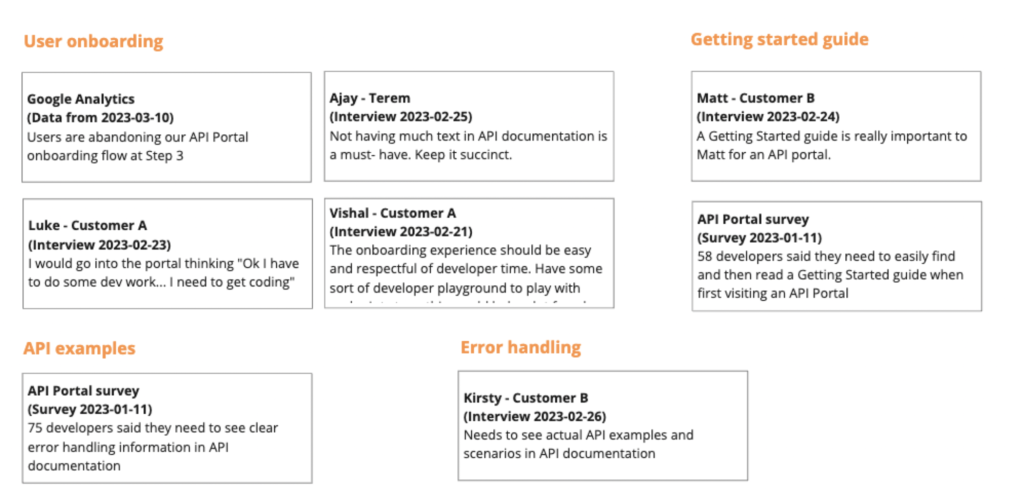
3. Assign insight statements to each grouping of information snippets:
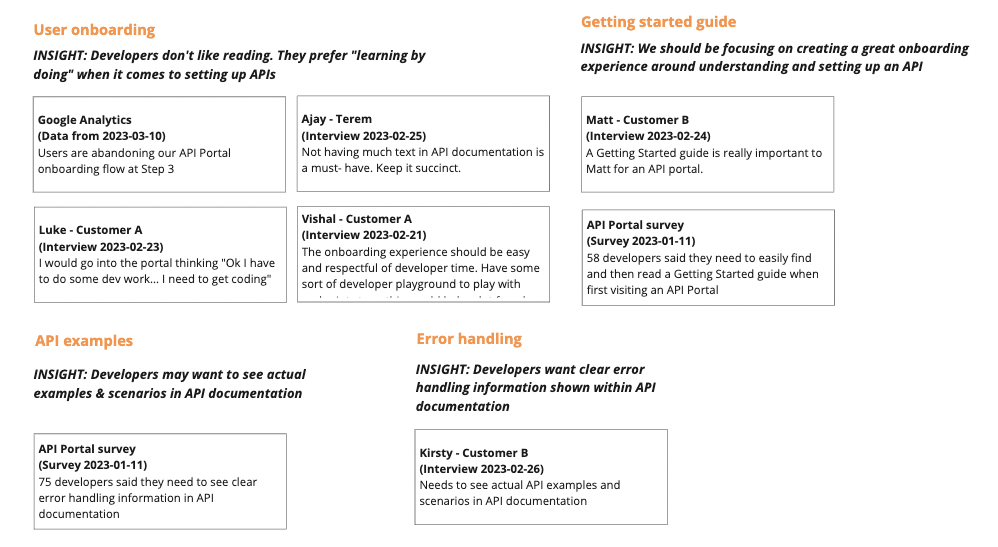
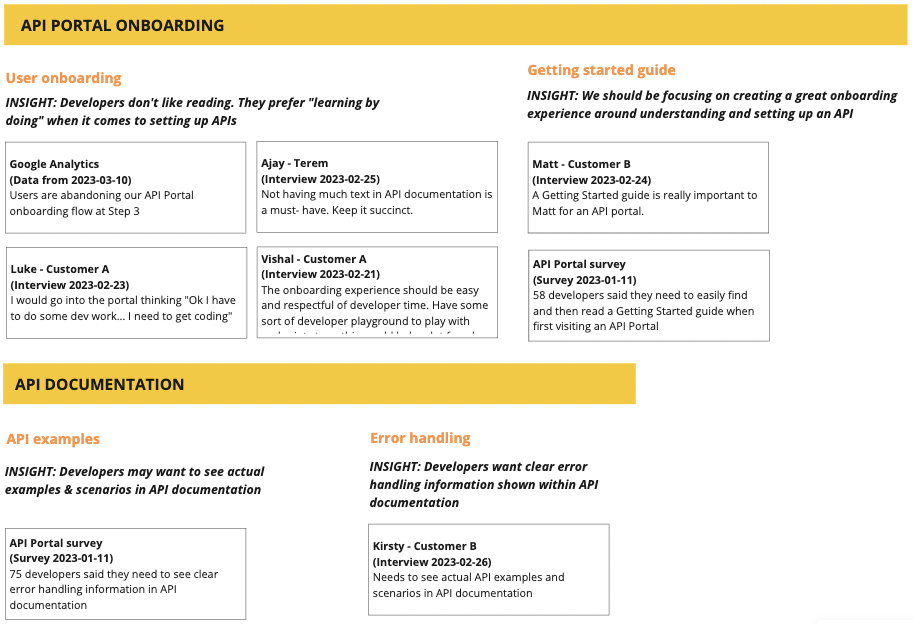
4. If multiple insight statements are conceptually related, assign an overarching theme (a higher level category) for those insight statements:
Regardless of which tool you use to store and display synthesised user research information, the process is the same, no matter which tool you use to organise the information.
It’s just a matter of what you prefer and how much data you have. If you have a mountain of data, for example, it may be preferable to create a spreadsheet like the one below.
Whichever format you choose to use, the document will become a living document that should be updated over time as new information comes to hand from your customers. Whoever has access to the document should therefore see the latest insights or hypotheses that have resulted from your ongoing user research activities and customer feedback.
Note that this process can also be employed using physical means, such as post-it notes or similar.
4. Formulate “How Might We” Questions
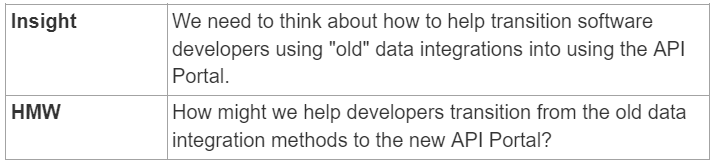
The last step is to formulate “How might we” (HMW) statements. These are used to translate insights into actionable solutions. They are small questions that reframe an insight statement gained from user research as a “problem” or “opportunity” that needs solving. These statements help you to focus on user needs and pain points (problems), rather than going straight into coming up with solutions.
“How might we” statements are formed from insight statements, in the format “How might we [do this thing]”.
For example:
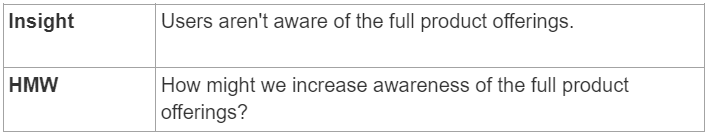
Or
For more information on how to formulate How Might We questions, see “Using “How Might We” Questions to Ideate on the Right Problems”.
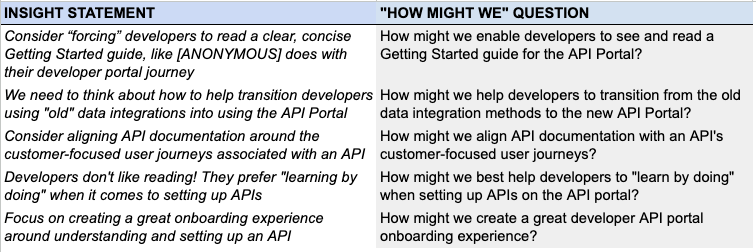
Here is an example of “How might we” questions generated from Insight Statements:
You should now have a good understanding of how to employ this process to make sense of all of your user research data, extract valuable and useful insights from them and sort and categorise them into a format that can be easily understood and used by anyone in your organisation.