The structure of a typical venture-style startup is essential to keep in mind when structuring the equity and cap table of a tech joint venture. You need to keep the typical startup cap table in mind because it’s what people are used to but also because it provides some useful lessons and insights.
While a new spinout or joint venture between two established companies may seem different – and in some ways it is – there are also similarities with a startup founded by a few cofounders.
Venture-style startups where some cofounders start a business and then raise capital to grow have now been around for decades and over time the model of how they work with equity has matured. This means there is rich history to borrow from in thinking about models and structures for equity.
We will review cap tables at venture-style startups by looking at three case studies. Through these case studies we will look at how the company starts, what each party contributes and how the cap table evolves. The case studies are:
- A Story of Two co-founders
- A Story of Three co-founders
- A Story That’s Not That Uncommon
Please keep in mind while reading that complexity and nuance will be missed but it is missed on purpose so as not to distract from the focus here, which is just to give an overview of venture-style startup cap tables. There are significantly better guides and resources available elsewhere for detailed analysis and thinking on startup cap tables.
A Story of Two Co-founders
Let’s take a look at a story of two co-founders who start a company together then raise venture capital over time.
- The two start out owning the business between themselves with a relatively low valuation.
- They then take on tens or hundreds of thousands in funding as a Pre-Seed or Angel round (the exact amount doesn’t matter so much for our purposes here).
- With this money they hit the milestones they need to hit so they are able to raise a Seed round of a million or more, followed by a Series A of a few million or maybe tens of million (again, amounts aren’t as important right now).
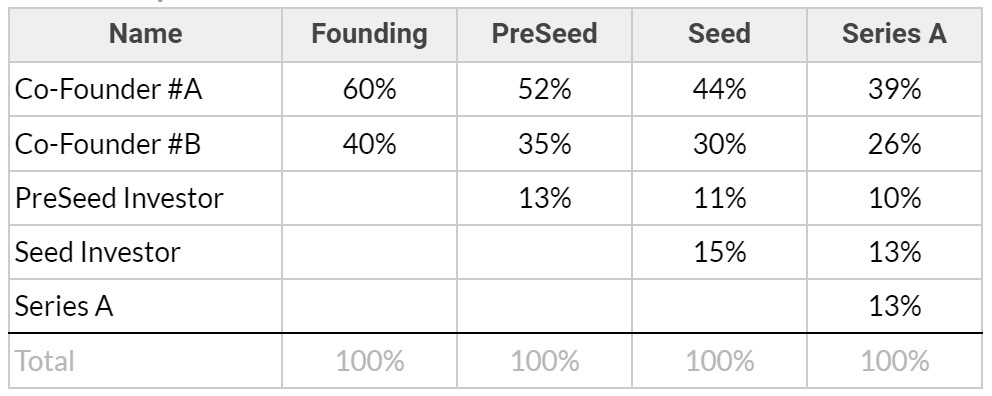
The valuation of the business is increasing at each stage and the percentage of ownership will likely look like this:
Table 1: Cap Table for two co-founders
A Story of Three Co-founders
A company started with three co-founders that follows a similar journey would look like this:
Table 2: Cap Table for three co-founders
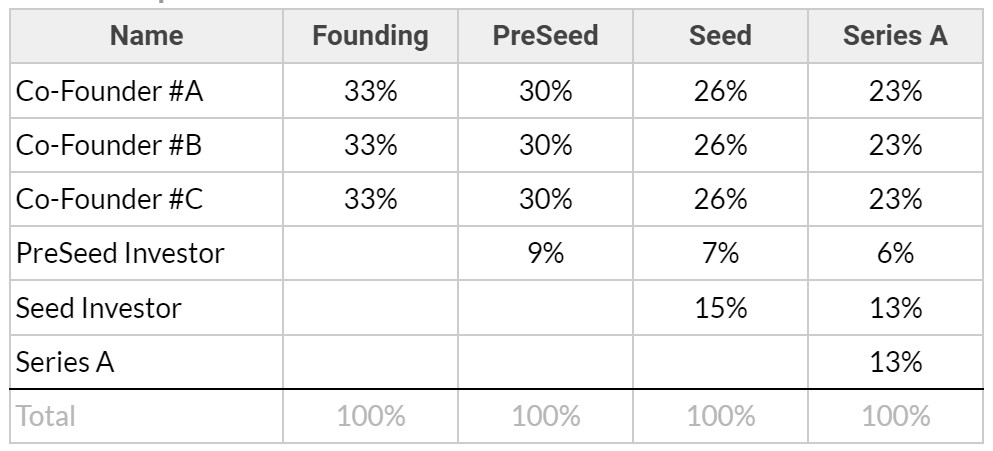
* If some of the numbers don’t exactly add to 100% it’s due to rounding. Decimal places weren’t included for ease of reading.
A Story That’s Not That Uncommon
So far each of the venture journeys we have walked through have shown a fairly linear path. The reality is that ventures can and often are built with shareholders contributing differently in different ways.
Let’s look at a journey that isn’t as linear. In this venture it’s co-founded by two people initially but over time one of the initial co-founders loses interest while two early employees decide they want to come on as co-founders.
At the beginning you have:
- Co-founder A: begins the company, forms the team, funds the risky first year and negotiates the setup then stays involved at management/strategy/board level. Rolls up sleeves when needed – sales calls, presentations, investor network.
- Co-founder B: builds and tests the product for no salary to get the first customer then decides that the startup life isn’t for them so they take a job elsewhere.
They then raise a Pre-Seed round of a few hundred thousand.
Then, a bit further down the line you have:
- Co-founder C: paid a salary, after a few months gains confidence and invests.
- Co-founder D: initially paid a full salary, then opts to come on as a co-founder.
The venture does well and they manage to raise a Seed then Series A.
The table below shows what a cap table for a startup journey like this might look like:
Table 3: Cap Table for a Not So Uncommon Journey
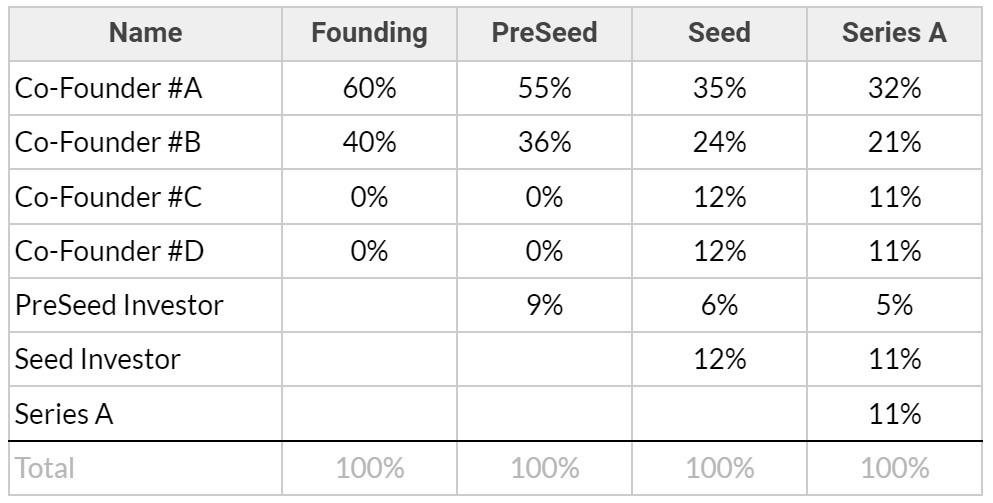
You can see that co-founders end up somewhere around 10-30%.
Even if you shift around when the co-founder joins or leaves you still end up with a cap table that looks somewhat like this.
A Story of Beyond Seed and Series A
The stories illustrated above may continue beyond the Seed and Series A Funding Rounds through additional funding rounds.
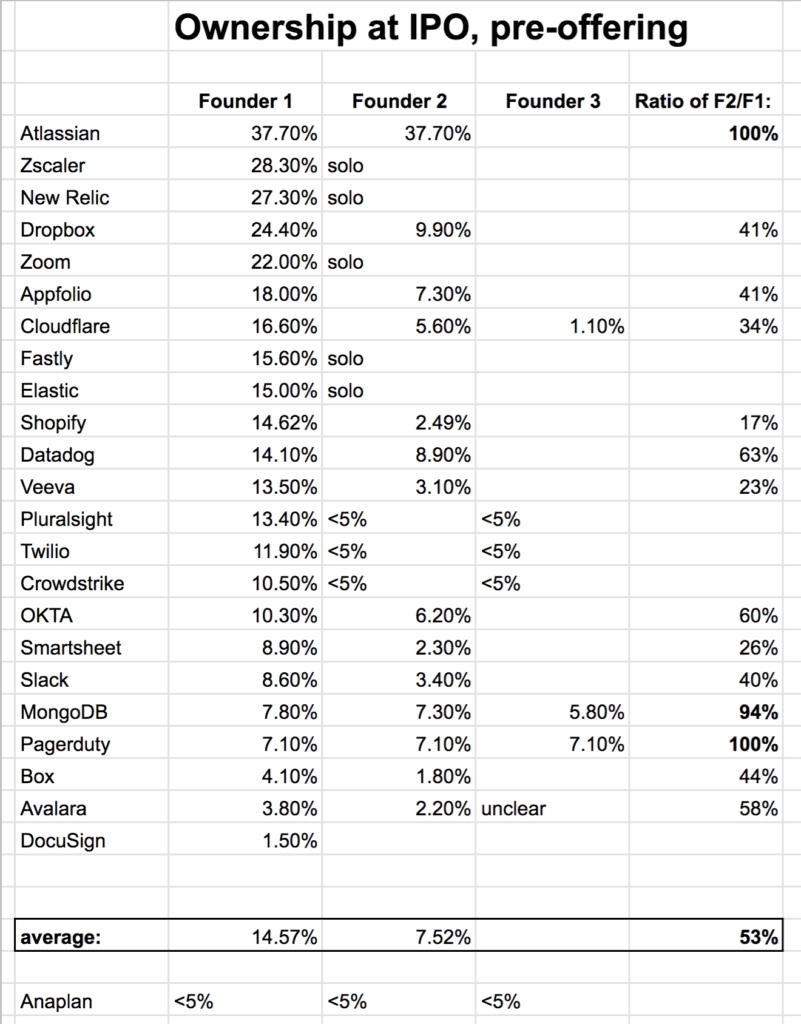
To see show this plays out, SaaStr compiled a table analysing ownership of different ventures by founders at IPO:
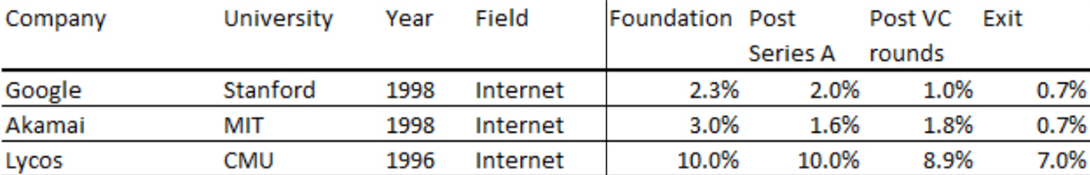
Another analysis looked at S-1 filings to see what percentage of ownership universities – the creators of the original intellectual property in some way – eventually held. Here is a snippet:
What Can We Learn From Venture-style Cap Tables?
There are some other aspects to venture-style startup cap tables that are worth considering:
- Investors expect cap tables to look somewhat like those in the stories above.
- Talented people like employees, executives and advisors also expect your equity to be structured something like what we’ve shown above.
- You need to price a round so that it has upside for everyone and ensures you can hit the next round. Focusing on the value of the equity instead of the percentage can be helpful here.
- In the early days allocation of equity is a lot to do with the parties future contributions and incentive to execute as well as their contributions to date.
- It’s hard to predict or determine exactly what your funding rounds in the future will look like so you need to allow for options and flexibility.
- Allocating a meaningful proportion of equity to employees is a must have.
Next
In the next part of the guide we will look at structuring the equity of a new tech joint venture.
More of this guide: