
Calculating the return on investment (ROI) of improvements to retention can seem like a daunting or complex task. But, finding a simple way to articulate your ROI will make it easier for your team and management to understand, and will ultimately drive a better decision about the value of the improvements.
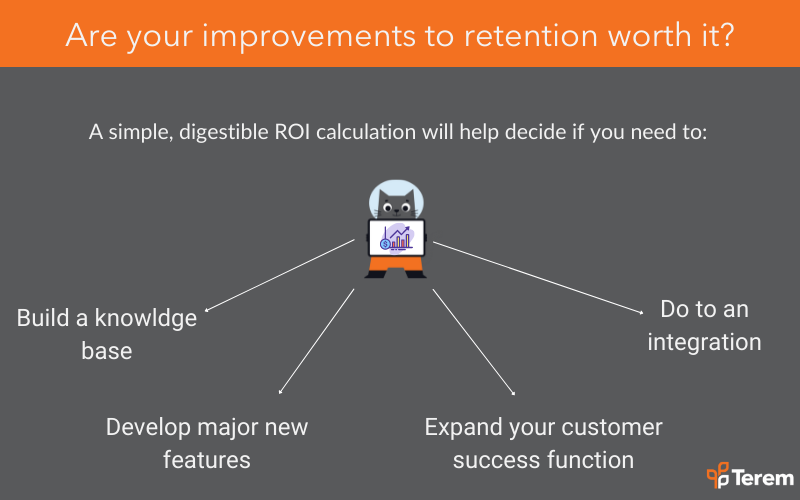
The following formula is useful for determining whether to invest in a major new initiative, as well as giving you an outline of how much you can afford to invest. Some specific examples of initiatives it might help with are:
- Determining whether to build a major new feature/product (e.g. an API or mobile app)
- Determining whether to expand your customer success function
- Determining whether to do an integration
- Determining whether to build a knowledge base
Where this formula falls short – on purpose – is taking into account some of the nuances of retention, such as cohorts, customer segments, and customer growth over time. But this simplicity is its strength. Without a clear and uncomplicated formula, your calculation would get caught up in sensitivity analysis and endless debates about the inputs.
Use this as a quick formula both at the outset of your program, and along the way to sense check. If you’re making a big decision, or one that requires more detail, then you’ll need to expand beyond what this article provides.
Another key part of this formula is the way it is explained. Having the step by step guide helps those around you easily understand your logic, and allows them to help you improve on it to get to a decision.
Let’s get to the formula now.
Calculating the ROI of Retention Improvements
There are two approaches to choose, depending on the data you have on hand. Using Customer Lifetime Value is the ideal basis (revenue from the customer minus direct costs associated with the customer), however many businesses do not have this as readily available and accurate as Customer Lifetime Revenue (total revenue you expect to earn from a customer).
Approach A: Using revenue only
Let’s first estimate lost revenue from customers churning:
- If we have a churn of X% (X% = [Your churn])
- And we have C customers in the vertical (C = [How many customers you have])
- With an average of $CLR lifetime revenue per customer (CLR = [What your CLR is])
- Then churn is currently costing you $Z per month for this vertical (and growing [if your customer base is growing]) where $Z = (X% * C) * $CLR = $?
- So churn per year is costing $T = 12 months multiplied by $Z = [Calculate the lost revenue per year.
Therefore, the potential increase in revenue per year from our initiative of XYZ to reduce churn is shown below by the percent reduction in churn delivered. An assumption of [GM%] gross margin on revenue has been used.
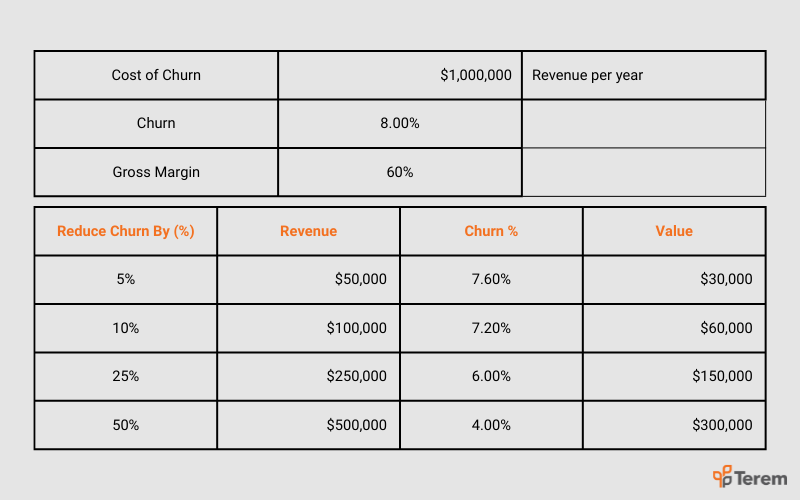
<insert your disclaimers, data sources or footnotes here>
Approach B: Using customer lifetime value
Let’s first estimate value lost from customers churning:
- If we have a churn of X% (X% = [Your churn])
- And we have C customers in the vertical (C = [How many customers you have])
- With an average of $CLV lifetime value per customer (A = [What your CLV is])
- Then churn is currently costing you $Z per month for this vertical (and growing [if your customer base is growing]) where $Z = (X% * C) * $CLV = $?
- So churn per year is costing $T = 12 months multiplied by $Z = [Calculate the lost revenue per year.
Therefore, the potential increase in revenue per year from our initiative of XYZ to reduce churn is shown below by the percent reduction in churn delivered:
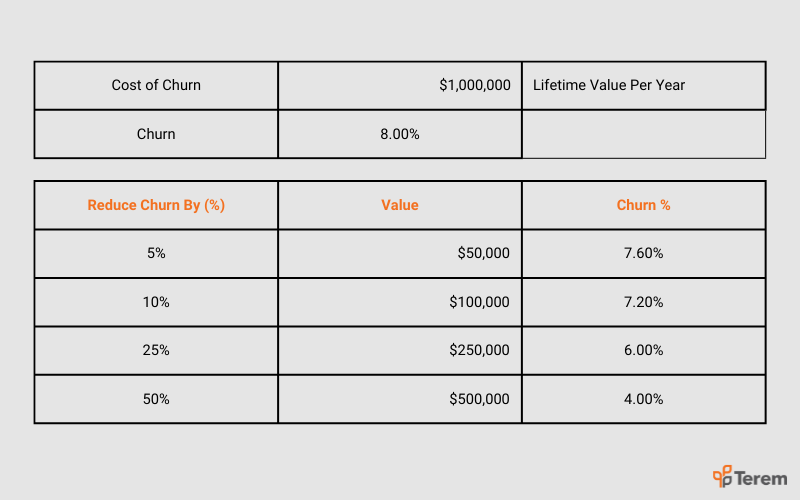
<insert your disclaimers, data sources or footnotes here>
Disclaimers, Data Sources and Notes
Underneath your calculations it’s worth adding notes, disclaimers, and data sources with the 1 notation that links through to a numbered list.
Here are some disclaimers for you to send along with the formula, to help set expectations and highlight where more work might be required:
- This is a point in time estimate based on single values. For example, it does not take into account how churn changes over time or growth in customers over time.
- This number is an average (mean) and the median is [higher|lower] at [X].
- The Gross Margin only includes X, Y and Z costs but does not account for A, B and C.
Summary
These formulas are really meant to provide you with a clearly articulated starting point. You then need to use your judgement or insights you’ve developed around what level of improvement you can make to churn and retention. You need to work out if the granularity is enough for your purposes—that is, do you have sufficient information about your ROI to justify more or less investment.

Scott Middleton
CEO & Founder
Scott has been involved in the launch and growth of 61+ products and has published over 120 articles and videos that have been viewed over 120,000 times. Terem’s product development and strategy arm, builds and takes clients tech products to market, while the joint venture arm focuses on building tech spinouts in partnership with market leaders.
Twitter: @scottmiddleton
LinkedIn: linkedin.com/in/scottmiddleton