
This is Part 3 of a comprehensive guide to product bugs. This part of the guide focuses on product bug reports. It provides templates and examples that you can take and apply straight away. Then, through the reports, you’ll see various ways of presenting information so that you and your stakeholders can make good decisions about bugs.
Before going onto product bug reporting, let’s quickly recap on what we’ve covered so far in this guide to product bugs. Part 1 explored what product bugs are, why they occur, where they come from, and why they do and don’t matter. Part 2 looked at how to manage product bugs, including strategy, prioritisation, triage and more.
With that background, reporting is an enabler for effective communication with your team and your stakeholders (customers, your manager, other teams). It will help you arrive at better decisions and, when the heat is on, buy you breathing space to get through the fixes.
If done poorly, bug reporting puts unnecessary pressure on a team and can cause disasters. When done well, bug reporting means business-as-usual without any fuss.
Importantly, reports aren’t an outcome in themselves. They don’t achieve anything on their own. So you need to match the effort of the report with the situation. For example, don’t create 32 charts and two pages of commentary if the situation really only needs a callout of the bugs that are blocking a release. On the flip side, don’t send three bullet points once per week when the entire business and thousands of customers are in serious trouble because of a buggy release.
The bug report examples and templates we’ve put together start from simplest, then progress to more complex.
I’ve used email examples as the format to share these in; however, the data and charts could be automatically sent from your task management tooling, or you could even build dashboards. Email, for now, makes it simple and easy for others to consume. I’ve also found email is where this reporting usually ends up because key stakeholders like customers and senior management don’t want to login to your Jira/TFS/[insert PM tool here].

Small Number of Defects, Low Pressure
The following templates and examples are best when you have a small number of defects and a relatively low-pressure situation. They’re simple and fast to create.
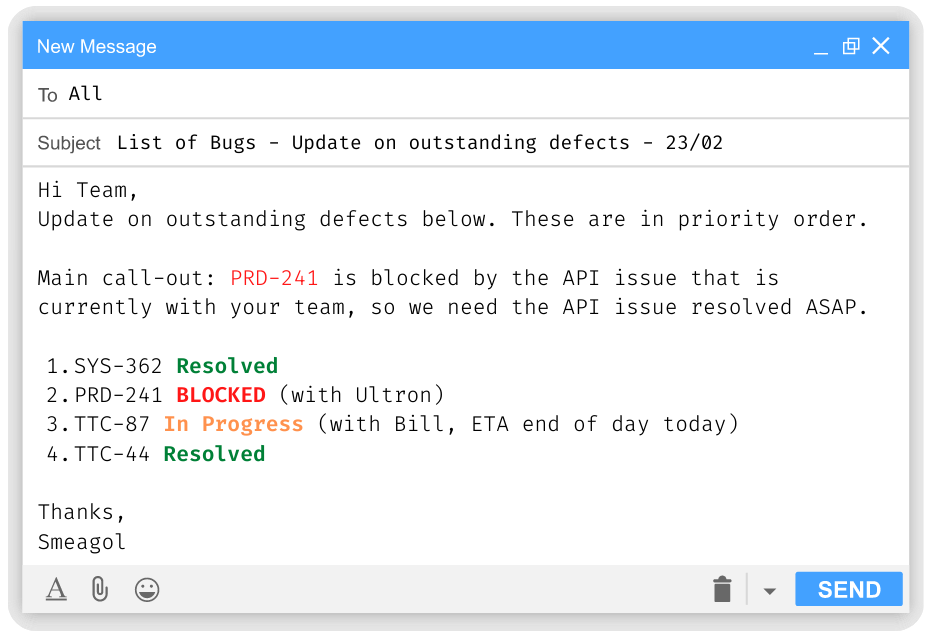
Example #1: List of bugs, a quick summary
In this template, you give a list of the bugs and provide a quick summary of the overall status as well as the status of each bug. It’s useful when there are less than 10-20 bugs, and it’s a close-knit group of people. It helps keep everyone aligned.
You can add links to the bugs in your issue tracker. Colour coding the status is optional.
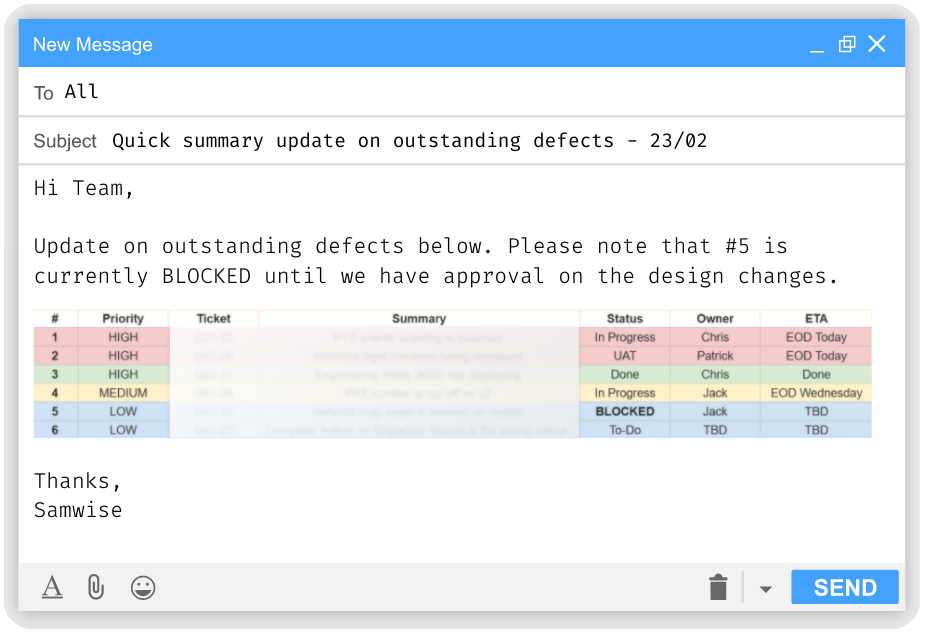
Example #2: Table of bugs, a quick summary
This example expands on the one above by providing a table for the outstanding bugs. The table provides a bit more information, so it’s more useful when people have less context about what is happening.
Example #3: Summary Only
When you have a few more than 10-20 bugs, and you need to give a brief overview, you can provide a brief summary along with an attachment of everything outstanding.
Here is an example:
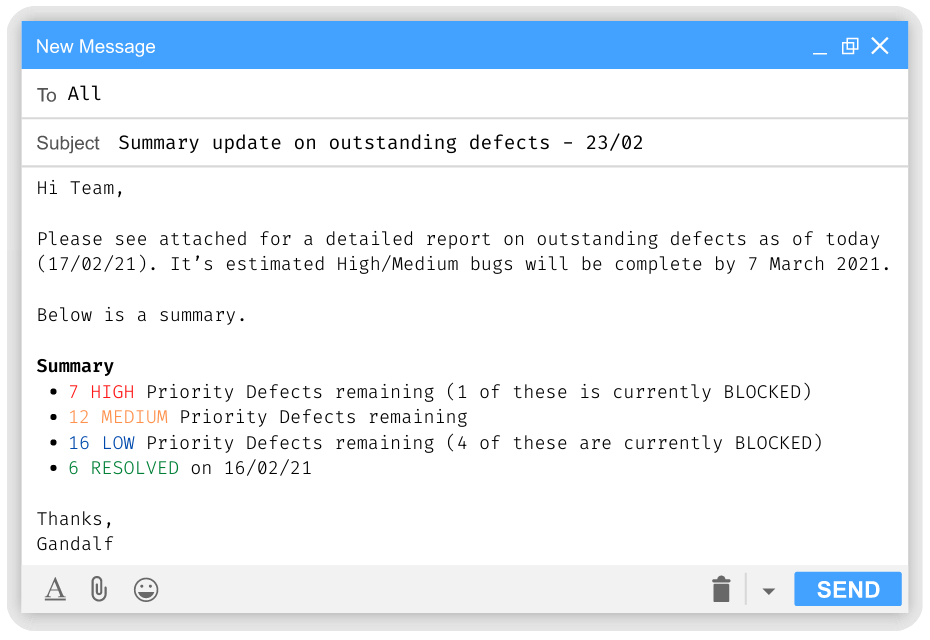
Don’t forget to include the attachment, which is usually an export from your bug management tool of choice.
The estimate on the release date is optional.
You could redo the bullet points in table form as well.
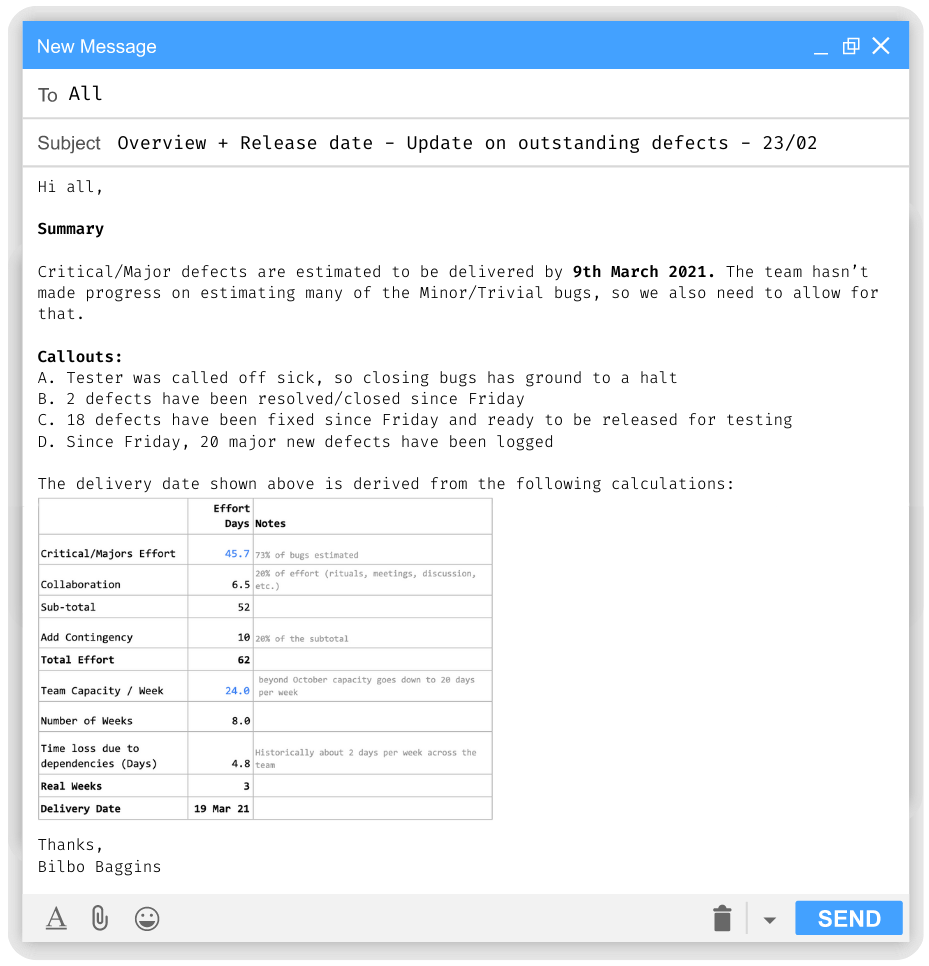
Example #4: When a brief overview and release date are important
In this next example, we’re still keeping it relatively simple but focusing on a brief overview and estimating a release date.
A spreadsheet drives the table that is included. The spreadsheet relies on your bugs being estimated by effort. So you’ll need to do that or convert your story points into the effort.
Large Number of Defects and Discipline Needed
When there is significant pressure on a release (or potentially could be) or a large number of defects/team members, you want to think about some more detailed reporting. Here are some examples and templates.
Note: the numbers may not always add up as they’ve been randomised quickly from real-world reports.
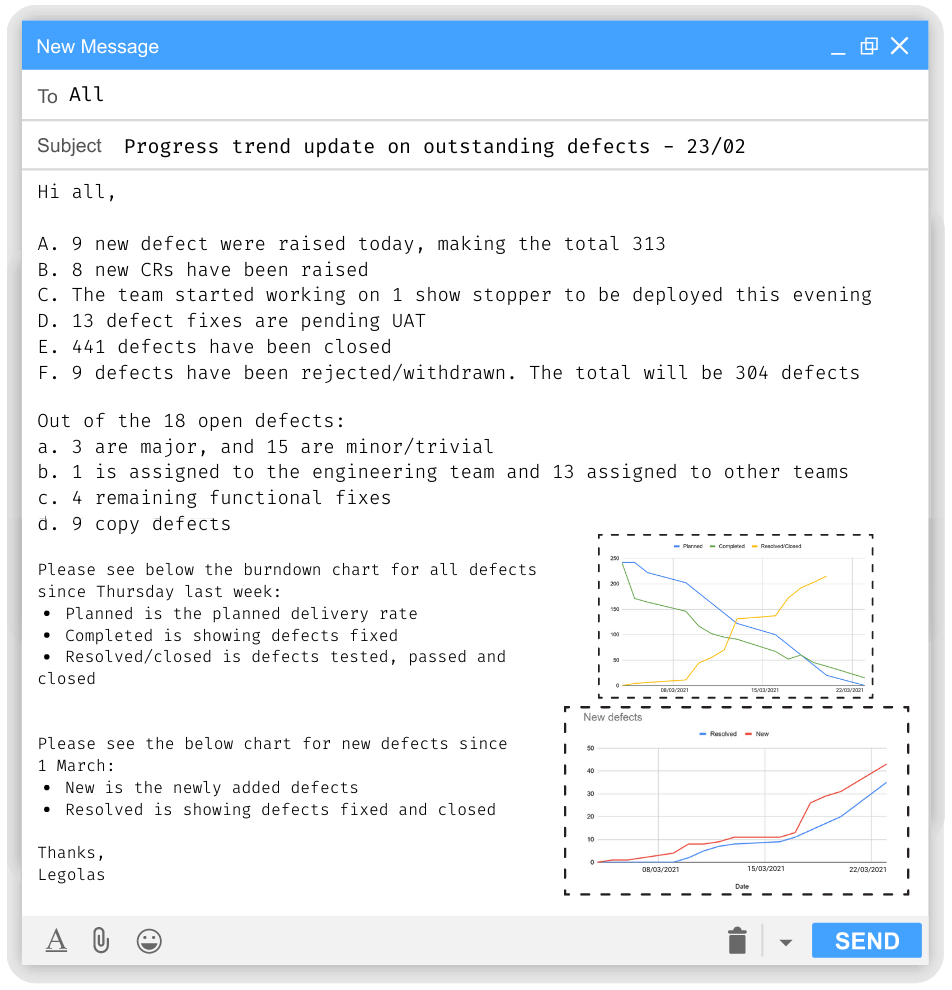
Example #1: Progress trend
This example is a bug report for usage where the general trend of progress is reported. You will see some definitions and explanations are included before the charts to help ensure everyone is aligned.
Letters are used for the list to allow people to refer to a point easily. Numbers weren’t used because they get mixed up with the bug counts and statistics, making it hard to read quickly.
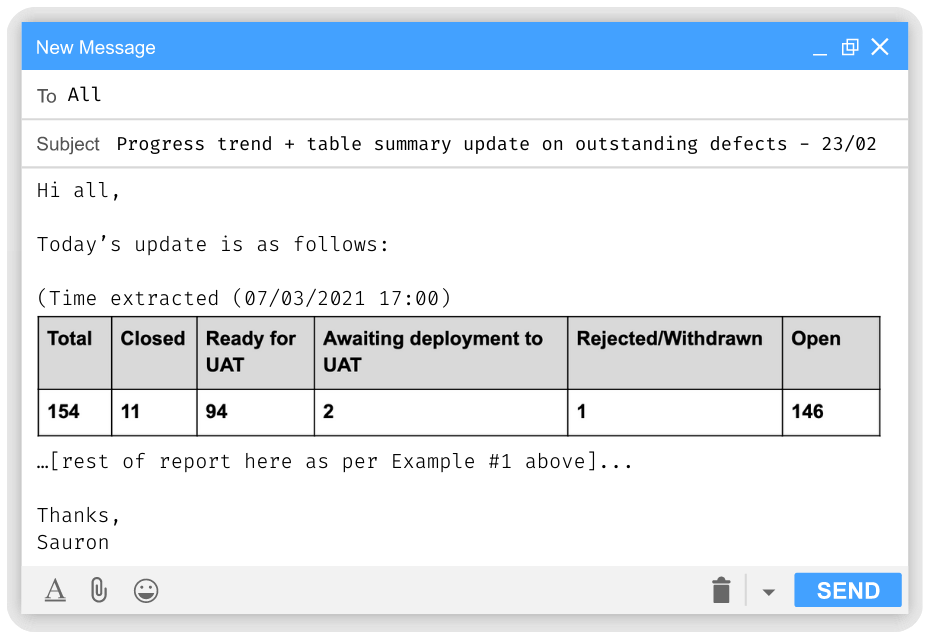
Example #2: Progress trend with a table summary
This example builds on the above one, inserting a table at the beginning, which gives your audience a faster way of digesting the product’s bugs’ overall status.
Graphs and Add-ons to Your Reports
Here are some graphs and other add-ons that you might want to use in your reports depending on your situation and what you want to communicate. If you download the templates, you will find a bonus email template to be used with these graphs.
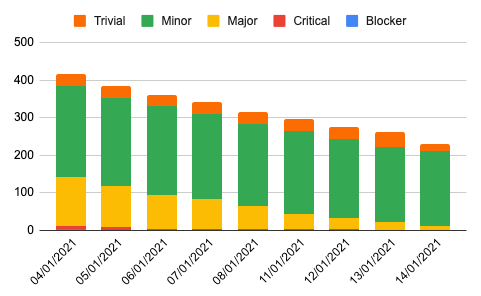
Example #1: Trend of progress by bug type/severity
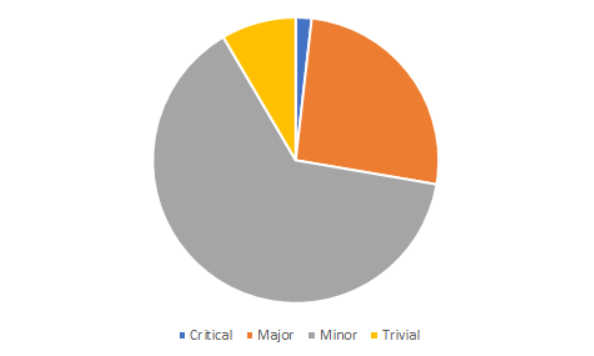
Example #2: Graphs for the overall state of defects
Here are some graphs that give you a point-in-time view of the overall state of your product bugs.
Graph1: Open Defect Count by Severity
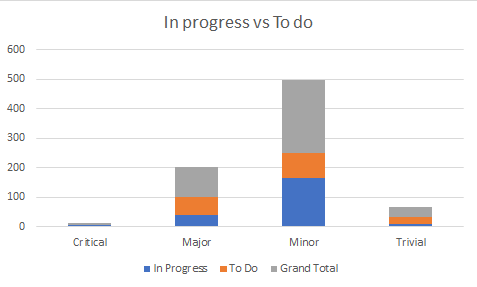
Graph 2: Open Defect Count by Severity and Status

Scott Middleton
CEO & Founder
Scott has been involved in the launch and growth of 61+ products and has published over 120 articles and videos that have been viewed over 120,000 times. Terem’s product development and strategy arm, builds and takes clients tech products to market, while the joint venture arm focuses on building tech spinouts in partnership with market leaders.
Twitter: @scottmiddleton
LinkedIn: linkedin.com/in/scottmiddleton